
Over the last few years, the demand to analyse the new types of data has caused significant changes to the analytical landscape. Today many organisations need to process and analyse high volumes of structured, semi-structured and unstructured data from hundreds if not thousands of data sources from inside and outside the enterprise. Furthermore, with industrial and consumer Internet of Things (IoT) now well underway, we are moving to a world where it will not be uncommon to see millions of data sources generating data for collection, processing and analysis. In fact, it is already happening in some industries such as manufacturing and oil and gas. The point about this is simple. When data warehousing was born 30 years ago with the publication of the Devlin and Murphy paper at IBM[1], no-one ever imagined a scenario of hundreds of data sources, let alone thousands, hundreds of thousands or millions of them. Therefore, extract, transform and load (ETL) tools were built to speed up development of data cleansing, transformation and integration jobs without the need to write code to process data. However, the tasks of initial discovery of data in a data source, determination of its meaning, data profiling and specification of policies, rules and mappings to clean, transform and integrate that data on route to the target were all left to the IT professional. In other words, these tasks were still, to a large extent, manual. ETL tools have been very successful in improving productivity, managing job execution and offering metadata lineage. They have worked well for internal on-line transaction processing (OLTP) system data sources where data was structured and well-understood. However, if you contrast that with requirements today, it is nowhere near enough in terms of capability. Yes, those OLTP systems are still there (albeit that many have moved to the cloud), but there are differences today in terms of the variety, volume, and velocity of data that it is being ingested from classic data warehouse data sources. There has also been explosion in the number of data sources. Furthermore, many of those data sources are coming from outside the business. Also, multiple different types of analytical workloads are now needed to produce the required insights and new data stores have emerged, beyond data warehouse analytical RDBMSs, that are optimised for different kinds of analyses. These include cloud storage, NoSQL graph DBMSs for graph analysis, Hadoop, and streaming data and analytics platforms. We are at the point within the enterprise where there is a broad spectrum of analytical activity going on beyond query and reporting in data warehouses. This includes supervised machine learning (e.g. to build predictive models), unsupervised machine learning (e.g. to cluster data), deep learning, natural language processing, graph analysis and streaming analytics. Many of these are now done at scale on technologies like Apache Spark.
While this sounds like progress, one of the side effects of all this is complexity in terms of data management. Multiple data stores exist, thousands of data sources have emerged, data is streaming, intermediate files are everywhere and data moving in all directions from cloud to on-premises, from on-premises to the cloud, from NoSQL DBMS to Hadoop, from Hadoop to RDBMS and back the other way. One thing is for sure, IT is not keeping pace with business demand and finding it difficult to hang on to the tail of data governance. In a UK survey done in September and October 2017, the evidence of this was clear when 250 enterprises came out saying that enterprise information management and self-service data preparation were the top two technologies needed in 2018[2]. Also, performing many of the aforementioned tasks manually is no longer practical going forward. We need a step change in data management software productivity that allows us to deal with the complexity while opening up the ability to involve business analysts and data scientists so that IT and business work collaboratively on the same data projects to produce the trusted data for analysis. Tasks need to be automated to on-board new data rapidly and allow processing to start quickly. Also, intermediate results need to be shared so that everyone knows what has and has not yet been produced. To make that possible requires smart data management software that ships with user interfaces for IT and business and that provides built-in analytics to automate data discovery, data profiling, semantic tagging, data governance classification, data cataloguing and even data mapping.
We need automatic recognition of popular data like social security numbers, post codes, names, addresses, monetary amounts, dates, times etc. We need automatic correction of data (e.g. addresses) and we need software that is self-learning and extensible so as to get better and better at automation and improve productivity. To clear the backlog, we need to allow business professionals using self-service data preparation and IT professionals using ETL tools to share metadata specifications and intermediate datasets in a collaborative development environment all integrated with an information catalog. For this to happen, it means that an information catalog becomes central to everything so that everyone knows what data is where in this ever-increasing complex data landscape. It also meand that tools such as data science workbenches, BI tools, self-service data preparation tools and ETL tools all need to be able to have access to and publish to the catalog. Also, with so many data sources, automated data discovery, profiling, cataloguing, change detection and search of data across multiple data stores is critical to success and should be core a core capability of the information catalog. Automated discovery in information catalogues looks at each and every data item in an attempt to automatically work out what the data is and what it means. Pre-defined patterns, user-defined patterns and analytics help automatically identify what the data is, how to name it, how to classify it (for governance purposes) and if it relates to other data already catalogued. This artificial intelligence approach is fast and ideal in helping us create and manage so called ‘logical data lakes’ that consist of multiple data stores (both on-premises and in the cloud) where data is often being ingested from data sources that are rapidly increasing in number and may be not well understood. It also allows semi-structured data to be discovered and potentially even structured data to be automatically derived from unstructured data during the discovery process (e.g. via natural language processing). Without this, there is no way that we will keep pace with demand. This approach also means that mapping of disparate data to common business vocabularies can also be automated so that companies can build on their investment in a business glossary or get one started.
What about governance, I hear you say? Of course, 2018 is the year of data governance with GDPR becoming active in May. The aforementioned complexity that has emerged with respect to data stores and data sources means that data governance is now a real challenge. Judging by the results of my very recent global data lake survey there is still a lot to do. Figure 1 shows the results of a question on data governance that asks “Which data governance disciplines can you currently monitor with tools you already have in place?”. The results are not great. As you can see, a lot more are confident about data access security than they are about data privacy. Of course GDPR is about both but mainly data privacy. Only 36% believe they are managing data privacy which of course means 64% are not. Surprisingly, data quality still impacts organisations despite having dominated the data governance scene for over a decade with 37.5% (100% – 62.5%) struggling in this widely discussed area. Data lifecycle management fairs even worse with 75% having not got it under control at all. Also, not even a quarter of respondents offer any form of data provenance. Metadata lineage is sorely needed.
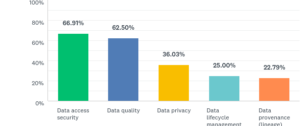
Figure 1 – Source: Intelligent Business Strategies Global Data Lake Survey, November 2017
To tackle data governance in such a complex data landscape, you need to define the policies and rules once and enforce them everywhere across all those data stores where the same data appears. The answer here is to identify what data is where, classify the data (e.g. personally identifiable data – PII), then tag it so that you know how to govern it. The next thing is to attach the rules to policies and policies to tags. Therefore, if the data exists in multiple data stores, it can be automatically recognized, with every instance given the same semantic tag. In addition, each data instance would likely be classified (e.g. PII) the same way with a governance tag to know how to govern it. Therefore, the same policy would apply no matter where the data is located across different data stores both on-premises and in the cloud. The catalog would therefore know where the data is, be able to automatically classify it using artificial intelligence or allow data to be manually classified. It would then provide the policies and rules to consistently govern it across heterogeneous data stores. The only other requirement is to have different enforcement engines in each of those environments to enforce the same policy in multiple data stores or to be able to pass the policy and rules into different underlying technologies (via metadata interchange) to enforce it that way. This is shown in Figure 2.
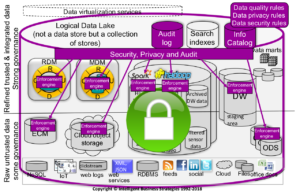
Figure 2 – Federated Data Governance in a Logical Data Lake – Define once, enforce everywhere
The good news is that all of this is starting to be rolled out by vendors in the data management market today. The trend is increasingly towards artificially intelligent data management software. If we embrace it and put it to work in an increasingly complex data landscape we stand a good chance of breaking down the walls between IT and business while remaining agile and still reducing time to value.
We shall be talking about all of these topics, at the Italian Enterprise Data and Analytics Summit in Rome in June 2018. I hope you can join us.
[1] An Architecture for a Business and Informati
Over the last few years, the demand to analyse the new types of data has caused significant changes to the analytical landscape. Today many organisations need to process and analyse high volumes of structured, semi-structured and unstructured data from hundreds if not thousands of data sources from inside and outside the enterprise. Furthermore, with industrial and consumer Internet of Things (IoT) now well underway, we are moving to a world where it will not be uncommon to see millions of data sources generating data for collection, processing and analysis. In fact, it is already happening in some industries such as manufacturing and oil and gas. The point about this is simple. When data warehousing was born 30 years ago with the publication of the Devlin and Murphy paper at IBM[1], no-one ever imagined a scenario of hundreds of data sources, let alone thousands, hundreds of thousands or millions of them. Therefore, extract, transform and load (ETL) tools were built to speed up development of data cleansing, transformation and integration jobs without the need to write code to process data. However, the tasks of initial discovery of data in a data source, determination of its meaning, data profiling and specification of policies, rules and mappings to clean, transform and integrate that data on route to the target were all left to the IT professional. In other words, these tasks were still, to a large extent, manual. ETL tools have been very successful in improving productivity, managing job execution and offering metadata lineage. They have worked well for internal on-line transaction processing (OLTP) system data sources where data was structured and well-understood. However, if you contrast that with requirements today, it is nowhere near enough in terms of capability. Yes, those OLTP systems are still there (albeit that many have moved to the cloud), but there are differences today in terms of the variety, volume, and velocity of data that it is being ingested from classic data warehouse data sources. There has also been explosion in the number of data sources. Furthermore, many of those data sources are coming from outside the business. Also, multiple different types of analytical workloads are now needed to produce the required insights and new data stores have emerged, beyond data warehouse analytical RDBMSs, that are optimised for different kinds of analyses. These include cloud storage, NoSQL graph DBMSs for graph analysis, Hadoop, and streaming data and analytics platforms. We are at the point within the enterprise where there is a broad spectrum of analytical activity going on beyond query and reporting in data warehouses. This includes supervised machine learning (e.g. to build predictive models), unsupervised machine learning (e.g. to cluster data), deep learning, natural language processing, graph analysis and streaming analytics. Many of these are now done at scale on technologies like Apache Spark.
While this sounds like progress, one of the side effects of all this is complexity in terms of data management. Multiple data stores exist, thousands of data sources have emerged, data is streaming, intermediate files are everywhere and data moving in all directions from cloud to on-premises, from on-premises to the cloud, from NoSQL DBMS to Hadoop, from Hadoop to RDBMS and back the other way. One thing is for sure, IT is not keeping pace with business demand and finding it difficult to hang on to the tail of data governance. In a UK survey done in September and October 2017, the evidence of this was clear when 250 enterprises came out saying that enterprise information management and self-service data preparation were the top two technologies needed in 2018[2]. Also, performing many of the aforementioned tasks manually is no longer practical going forward. We need a step change in data management software productivity that allows us to deal with the complexity while opening up the ability to involve business analysts and data scientists so that IT and business work collaboratively on the same data projects to produce the trusted data for analysis. Tasks need to be automated to on-board new data rapidly and allow processing to start quickly. Also, intermediate results need to be shared so that everyone knows what has and has not yet been produced. To make that possible requires smart data management software that ships with user interfaces for IT and business and that provides built-in analytics to automate data discovery, data profiling, semantic tagging, data governance classification, data cataloguing and even data mapping.
We need automatic recognition of popular data like social security numbers, post codes, names, addresses, monetary amounts, dates, times etc. We need automatic correction of data (e.g. addresses) and we need software that is self-learning and extensible so as to get better and better at automation and improve productivity. To clear the backlog, we need to allow business professionals using self-service data preparation and IT professionals using ETL tools to share metadata specifications and intermediate datasets in a collaborative development environment all integrated with an information catalog. For this to happen, it means that an information catalog becomes central to everything so that everyone knows what data is where in this ever-increasing complex data landscape. It also meand that tools such as data science workbenches, BI tools, self-service data preparation tools and ETL tools all need to be able to have access to and publish to the catalog. Also, with so many data sources, automated data discovery, profiling, cataloguing, change detection and search of data across multiple data stores is critical to success and should be core a core capability of the information catalog. Automated discovery in information catalogues looks at each and every data item in an attempt to automatically work out what the data is and what it means. Pre-defined patterns, user-defined patterns and analytics help automatically identify what the data is, how to name it, how to classify it (for governance purposes) and if it relates to other data already catalogued. This artificial intelligence approach is fast and ideal in helping us create and manage so called ‘logical data lakes’ that consist of multiple data stores (both on-premises and in the cloud) where data is often being ingested from data sources that are rapidly increasing in number and may be not well understood. It also allows semi-structured data to be discovered and potentially even structured data to be automatically derived from unstructured data during the discovery process (e.g. via natural language processing). Without this, there is no way that we will keep pace with demand. This approach also means that mapping of disparate data to common business vocabularies can also be automated so that companies can build on their investment in a business glossary or get one started.
What about governance, I hear you say? Of course, 2018 is the year of data governance with GDPR becoming active in May. The aforementioned complexity that has emerged with respect to data stores and data sources means that data governance is now a real challenge. Judging by the results of my very recent global data lake survey there is still a lot to do. Figure 1 shows the results of a question on data governance that asks “Which data governance disciplines can you currently monitor with tools you already have in place?”. The results are not great. As you can see, a lot more are confident about data access security than they are about data privacy. Of course GDPR is about both but mainly data privacy. Only 36% believe they are managing data privacy which of course means 64% are not. Surprisingly, data quality still impacts organisations despite having dominated the data governance scene for over a decade with 37.5% (100% – 62.5%) struggling in this widely discussed area. Data lifecycle management fairs even worse with 75% having not got it under control at all. Also, not even a quarter of respondents offer any form of data provenance. Metadata lineage is sorely needed.
Figure 1 – Source: Intelligent Business Strategies Global Data Lake Survey, November 2017
To tackle data governance in such a complex data landscape, you need to define the policies and rules once and enforce them everywhere across all those data stores where the same data appears. The answer here is to identify what data is where, classify the data (e.g. personally identifiable data – PII), then tag it so that you know how to govern it. The next thing is to attach the rules to policies and policies to tags. Therefore, if the data exists in multiple data stores, it can be automatically recognized, with every instance given the same semantic tag. In addition, each data instance would likely be classified (e.g. PII) the same way with a governance tag to know how to govern it. Therefore, the same policy would apply no matter where the data is located across different data stores both on-premises and in the cloud. The catalog would therefore know where the data is, be able to automatically classify it using artificial intelligence or allow data to be manually classified. It would then provide the policies and rules to consistently govern it across heterogeneous data stores. The only other requirement is to have different enforcement engines in each of those environments to enforce the same policy in multiple data stores or to be able to pass the policy and rules into different underlying technologies (via metadata interchange) to enforce it that way. This is shown in Figure 2.
Figure 2 – Federated Data Governance in a Logical Data Lake – Define once, enforce everywhere
The good news is that all of this is starting to be rolled out by vendors in the data management market today. The trend is increasingly towards artificially intelligent data management software. If we embrace it and put it to work in an increasingly complex data landscape we stand a good chance of breaking down the walls between IT and business while remaining agile and still reducing time to value.
We shall be talking about all of these topics, at the Italian Enterprise Data and Analytics Summit in Rome in June 2018. I hope you can join us.
[1] An Architecture for a Business and Information System, Devlin and Murphy, IBM Systems Journal Vol 27, No 1, 1988
[2] The Fourth Industrial Revolution Survey, Intelligent Business Strategies, Nov 2017
on System, Devlin and Murphy, IBM Systems Journal Vol 27, No 1, 1988
[2] The Fourth Industrial Revolution Survey, Intelligent Business Strategies, Nov 2017